1、使用plot函数绘制正弦曲线。x轴:x=0:pi/10:2*pi;设置x轴为0到2pi的范围,y:y=sin(x),绘图:plot(x,y);

2、使用xlabel,ylabel,legend等对图形即兴进一步的解释处理。
>> xlabel('x轴')
>> ylabel('y轴')
>> legend('y=sin(x)')
>> title('正弦曲线图')

1、plot3 Plot lines and points in 3-D space.
plot3() is a three-dimensional analogue of PLOT().
plot3(x,y,z), where x, y and z are three vectors of the same length,
plots a line in 3-space through the points whose coordinates are the
elements of x, y and z.
plot3(X,Y,Z), where X, Y and Z are three matrices of the same size,
plots several lines obtained from the columns of X, Y and Z.
Various line types, plot symbols and colors may be obtained with
plot3(X,Y,Z,s) where s is a 1, 2 or 3 character string made from
the characters listed under the PLOT command.
plot3(x1,y1,z1,s1,x2,y2,z2,s2,x3,y3,z3,s3,...) combines the plots
defined by the (x,y,z,s) fourtuples, where the x's, y's and z's are
vectors or matrices and the s's are strings.
2、plot3示例:t=0:pi/50:6*pi;
plot3(t.*sin(3*t),t.*cos(3*t),t)
grid

3、三维网格图:mesh;
[X,Y] = meshgrid(-8:.5:8);
R = sqrt(X.^2 + Y.^2) + eps;
Z = sin(R)./R;
mesh(Z);

4、surf函数:
k = 5;
n = 2^k-1;
[x,y,z] = sphere(n);
c = hadamard(2^k);
surf(x,y,z,c);
colormap([1 1 0; 0 1 1])
axis equal

5、surfc:
> [X,Y,Z] = peaks(30);
surfc(X,Y,Z)
colormap hsv
axis([-3 3 -3 3 -10 5])

1、bar:
y = [75.995 91.972 105.711 123.203 131.669 ...
150.697 179.323 203.212 226.505 249.633 281.422];
figure; bar(y);

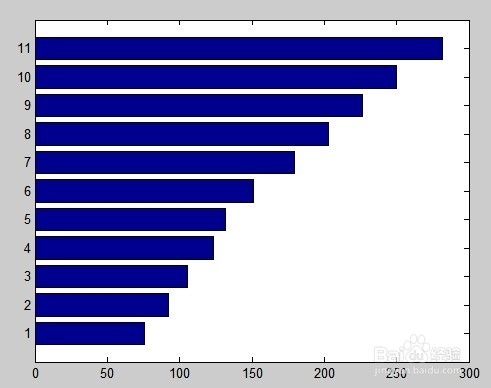
2、barh:
y = [75.995 91.972 105.711 123.203 131.669 ...
150.697 179.323 203.212 226.505 249.633 281.422];
figure; barh(y);
1、area:
Y = [1, 5, 3;
3, 2, 7;
1, 5, 3;
2, 6, 1];
area(Y)
grid on
colormap summer
set(gca,'Layer','top')
title 'Stacked Area Plot'

1、x = [1 3 0.5 2.5 2];
explode = [0 1 0 0 0];
pie(x,explode)
colormap jet

1、x = -4:0.1:4;
y = randn(10000,1);
hist(y,x)

2、rose:
figure
load sunspot.dat % Contains a 2-column vector named sunspot
rose(sunspot(:,2),12)

